Illustration showing various healthcare and community support services at home, including hospital, medical, community mental health, and sports centre, with people in wheelchairs, talking with healthcare workers, and engaging in recreational activities.

INFOGRAPHIC
Illustrations

Infographics are visual representations that combine illustrations, icons and key words to communicate information, ideas and processes.

I take chunks of text, charts and graphs and translate them into creative visuals to make communications more engaging and easier to understand.

Graphic with checkmarks and text: Capture interest, Enhance comprehension, Make message relatable, Build buy-in, Get people talking.

Illustration style and colours can be tailored to suit your brand guidelines and colour palette

INFOGRAPHICS are AWESOME for:

Client PROJECTS

Infographic titled 'GenAI Adventure' depicting a roadmap for a generative AI project. The path includes stages like direction setting, opportunity exploration, use case prioritization, and showcases achievements. Key events include three workshops: Workshop 1 on Sept 11, Workshop 2 on Sept 18, and Workshop 3 on Sept 25. Visual elements include eyes, stars, lightbulbs, and icons representing scanning, identifying, and sharing. The roadmap ends with scaling and proof of value.

“Speedy turnaround, quality WOW factor, a great asset for the client to show-off the project!”

Alastair Pryor
Generative AI Lead, frog part of Capgemini Invent

Illustration titled 'The Enterprise Change Management Roadmap' depicting five steps: 1) Start the ECM Journey, 2) Conduct Change Maturity Assessment, 3) Build Case for Change, 4) Develop the Change Management Framework, and 5) Sustain Outcomes. Features icons like flags, charts, and people, with arrows indicating progression and a note on changing capability."

SOCIAL MEDIA Posts

Infographic titled 'Australian Universities Accord' detailing a long-term plan for higher education reform. Key highlights include 47 recommendations, 2050 targets for tertiary and university attainment, strategies for equity, future-focused qualifications, research improvements, and funding strategies with a $10B strategic fund. Emphasis on lifting participation, addressing socio-economic challenges, and enhancing research and student support.

“Kathryn helped me to develop a promotional infographic on a very short timeframe. The infographic received 25,000 views and reposted over 65 times. The quality of her work was amazing and her willingness to work collaboratively was great.”

Luke Williams
Education Sector Lead, Capgemini Invent

Graphic ICONS & MODELS

Illustration of three people using digital devices with a large Wi-Fi symbol above them, symbolizing connectivity. The background features trees and checkmarks.
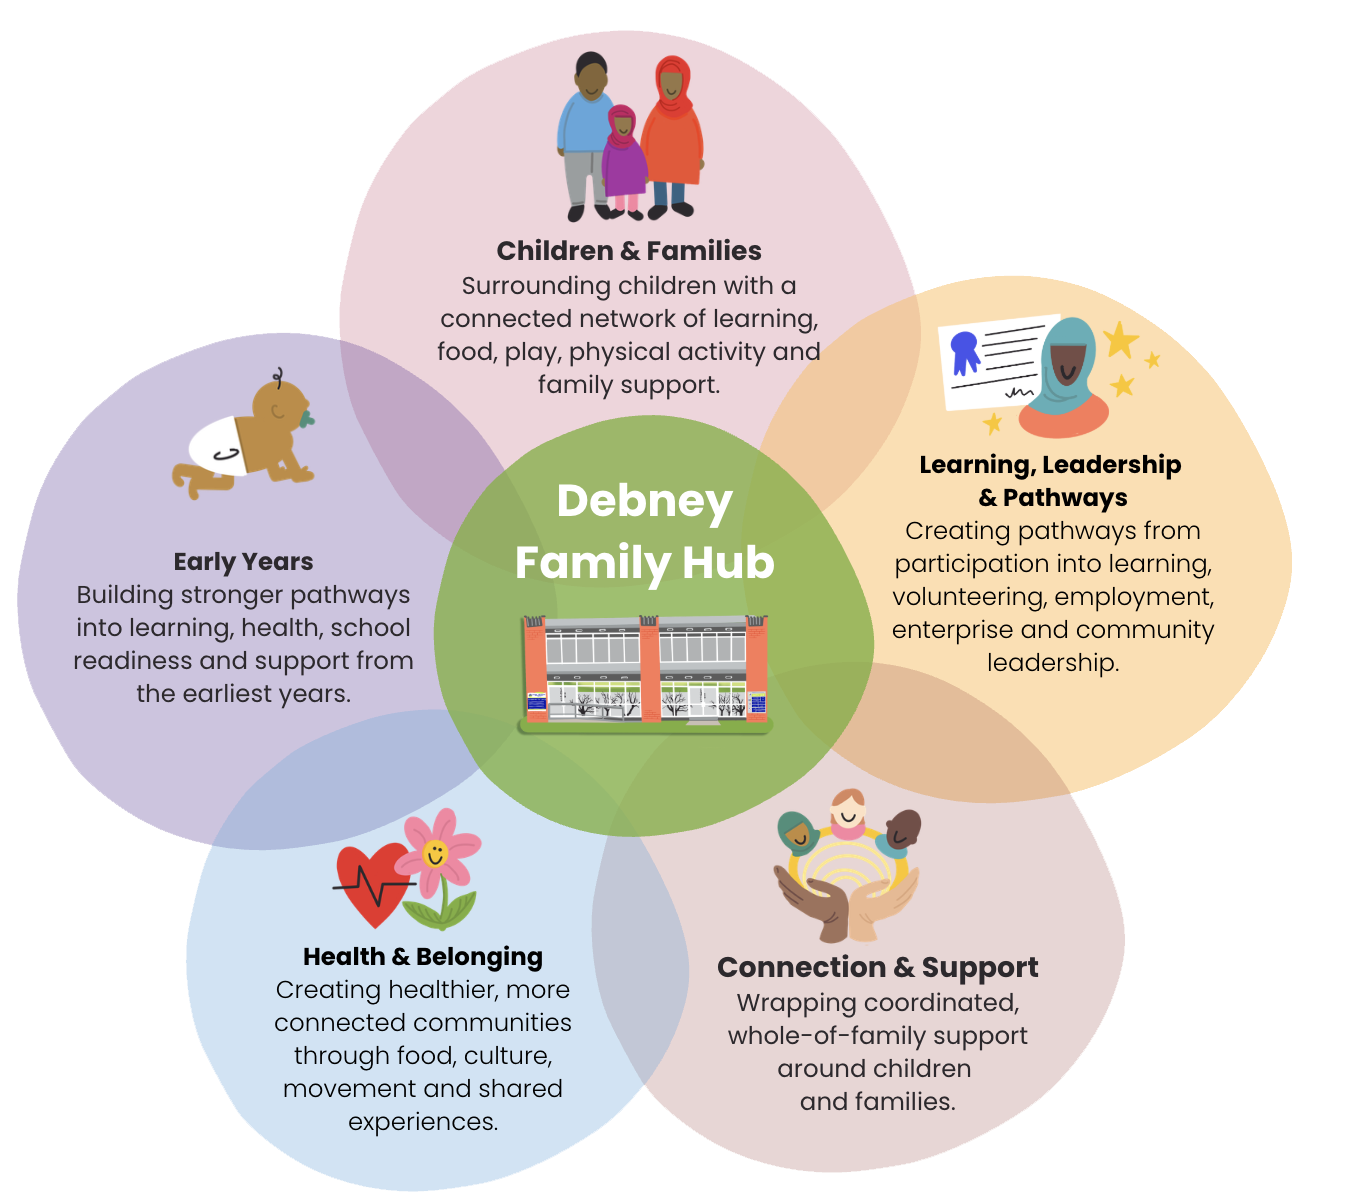
Venn diagram showing the components of the Debney Family Hub, including Children & Families, Early Years, Health & Belonging, Learning, Leadership & Pathways, Connection & Support, with icons like a family, baby, health heart, certificate, and hand holding children.

MARKETING & SALES‍

Infographic titled 'Horizon Business Plans Can Help!' highlighting support for Australian businesses impacted by COVID-19. Features include free Zoom consultations, business health checks, action plans, and ideas for reducing costs and changing directions. Emphasizes helping "Aussie businesses get back on track." Includes illustrations of a computer, checklist, graph, and dollar signs.

“Pictures tell a 1000 words.
Kathryn does brilliantly by capturing words in visually engaging images. Kathryn was amazingly helpful and took the initiative to get the job done efficiently and effectively. Huge thanks to Kathryn for her brilliant work!”

Andrew Wilson
Director, Horizon Business Plans
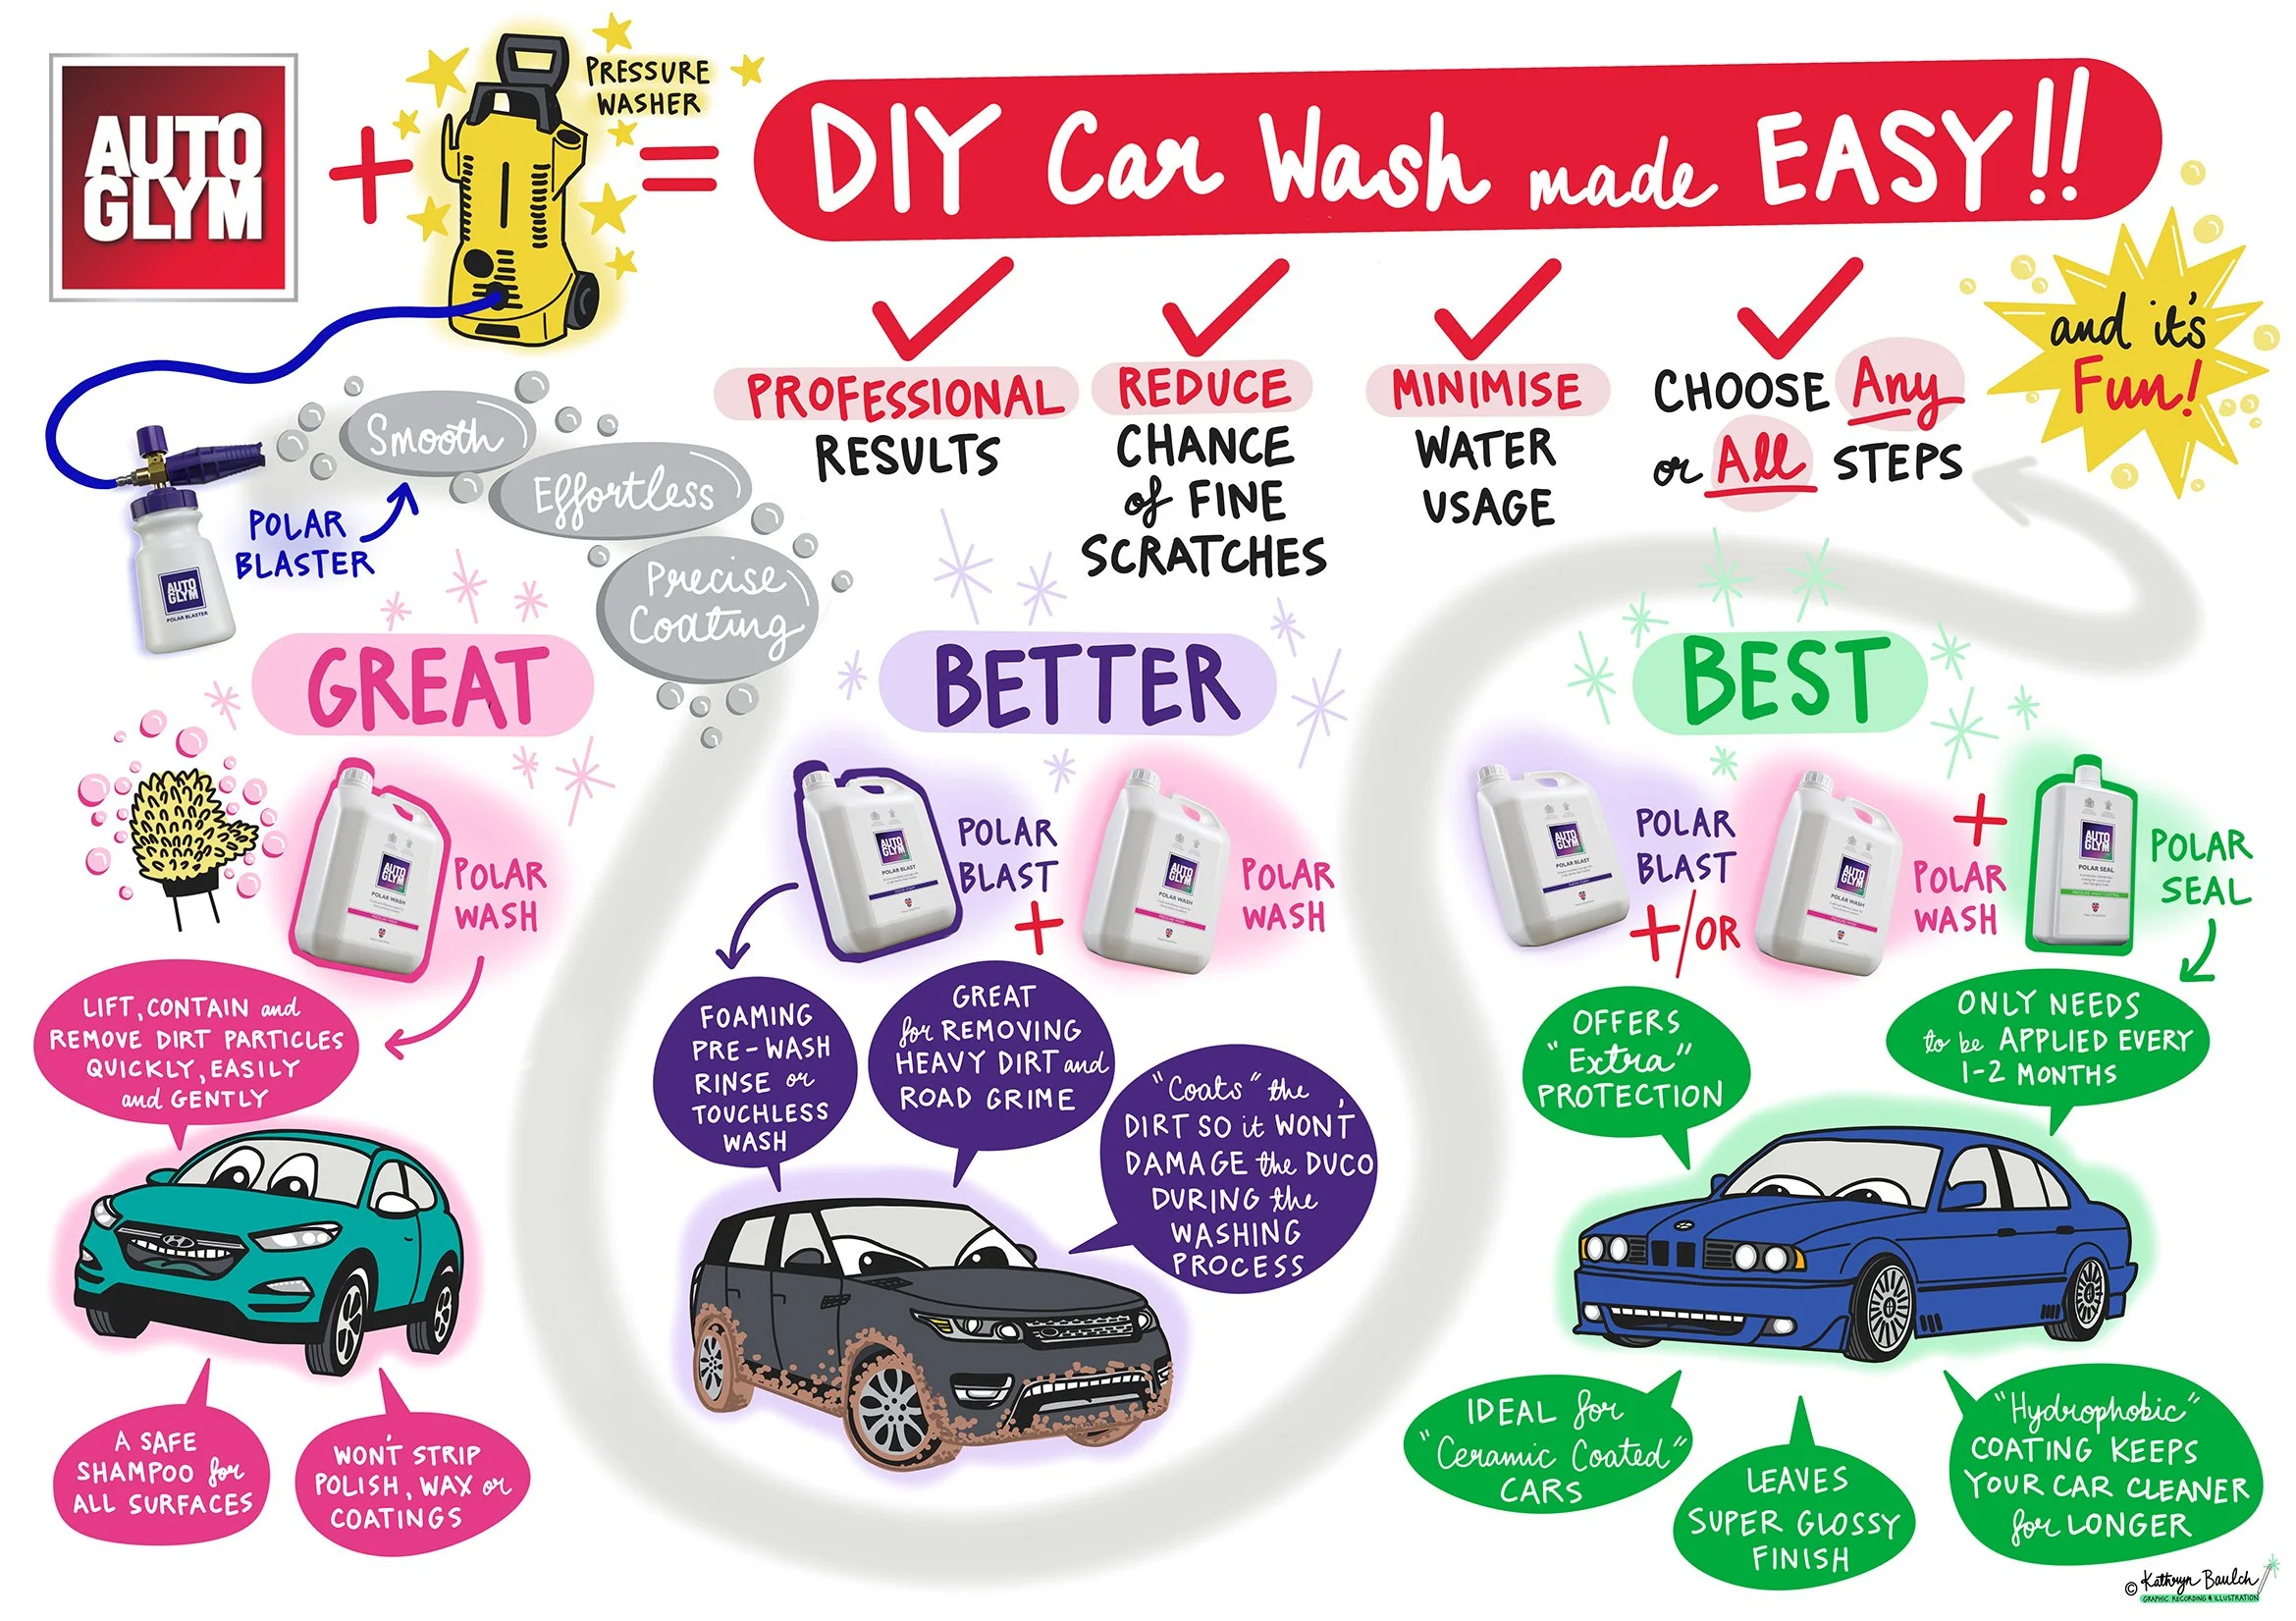
Infographic showing how to create an easy DIY car wash with products from Auto Glym. Features illustrations of different cars, cleaning products, and steps for washing, polishing, and protecting car surfaces.
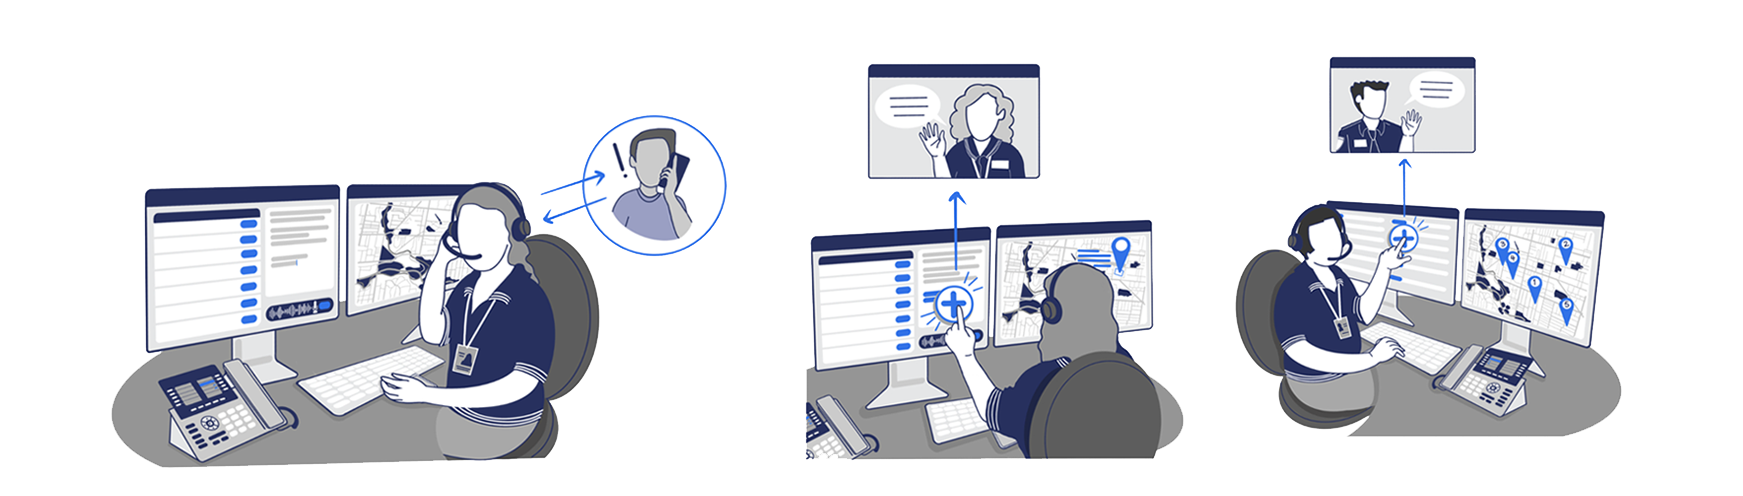
Three illustrations of call center agents working at desks with multiple monitors, headsets, and phones, communicating with clients via video calls and voice calls.

Bringing User Experiences TO LIFE

“Kathryn is excellent at visualising business concepts and the improvements they will bring. This is essential in communicating to the clients the benefits of the planned uplift and helps with stakeholder buy-in and alignment.“

Julia Grgurinovic
Senior Consultant, Capgemini Invent
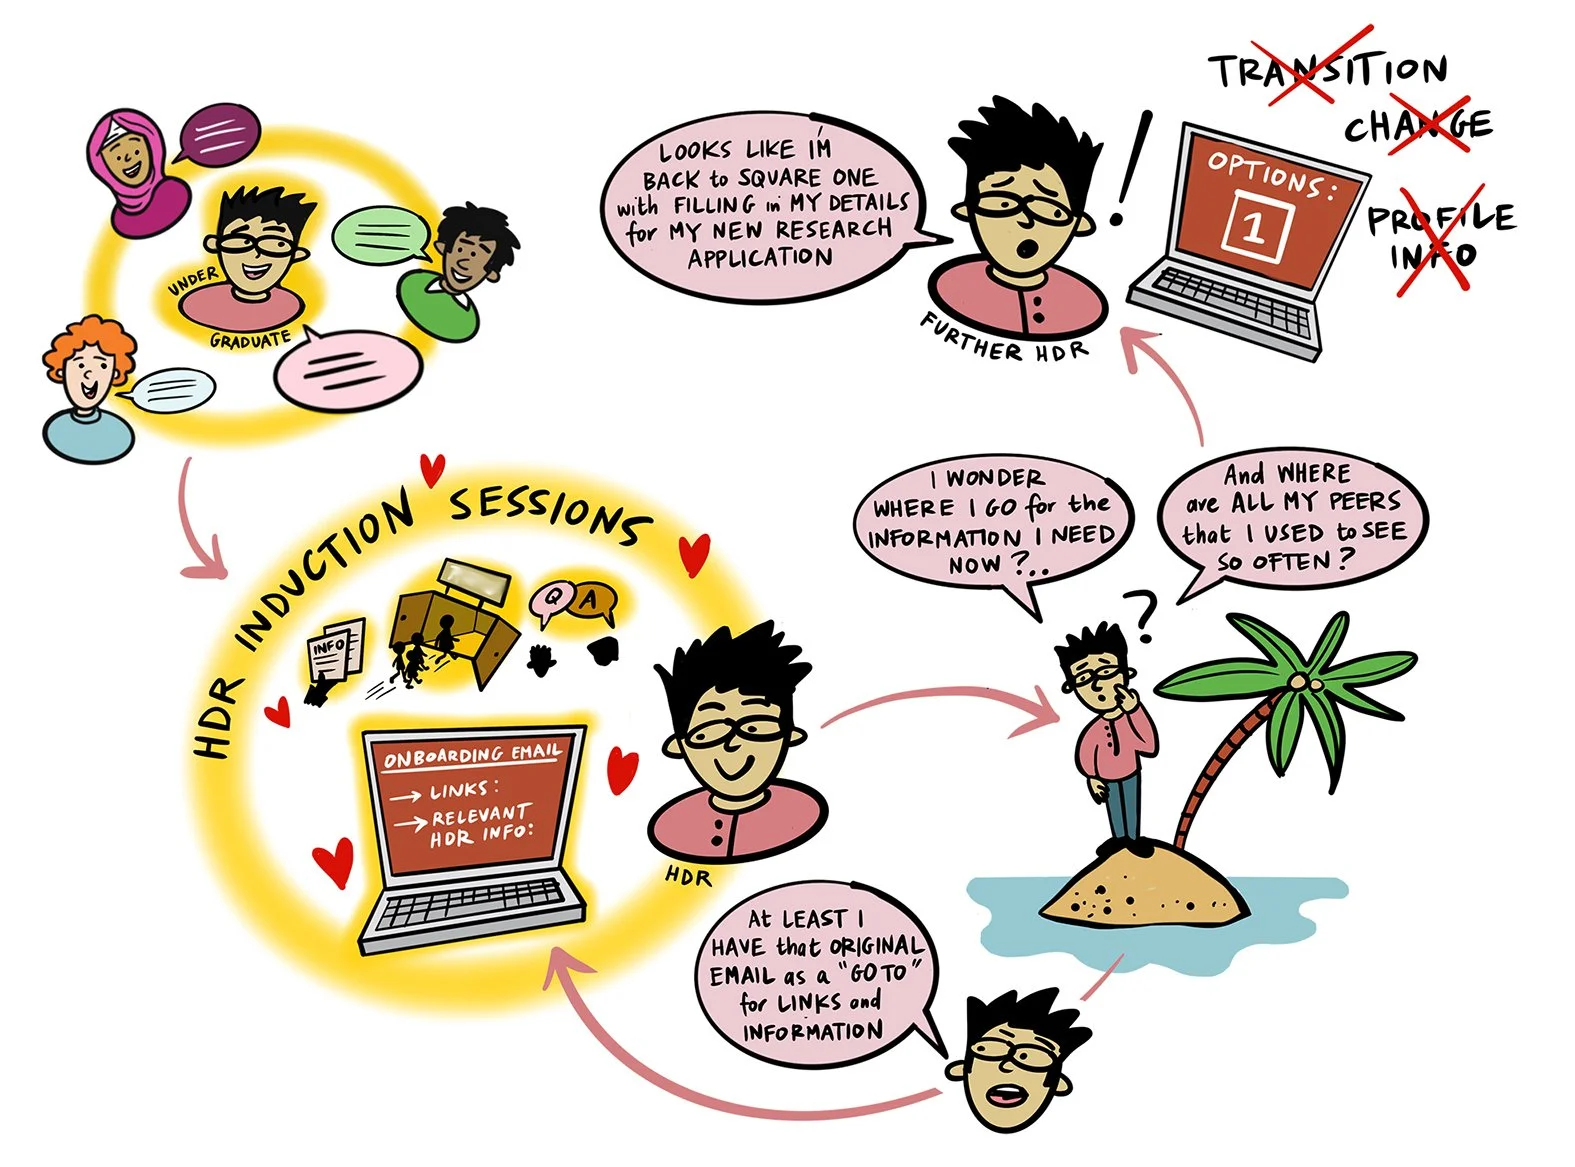
A colorful infographic illustrating a research process, including graduate students, HDR sessions, email links, and a person on a small island makes notes about research questions and information sources, emphasizing the importance of original emails and organized information for research.
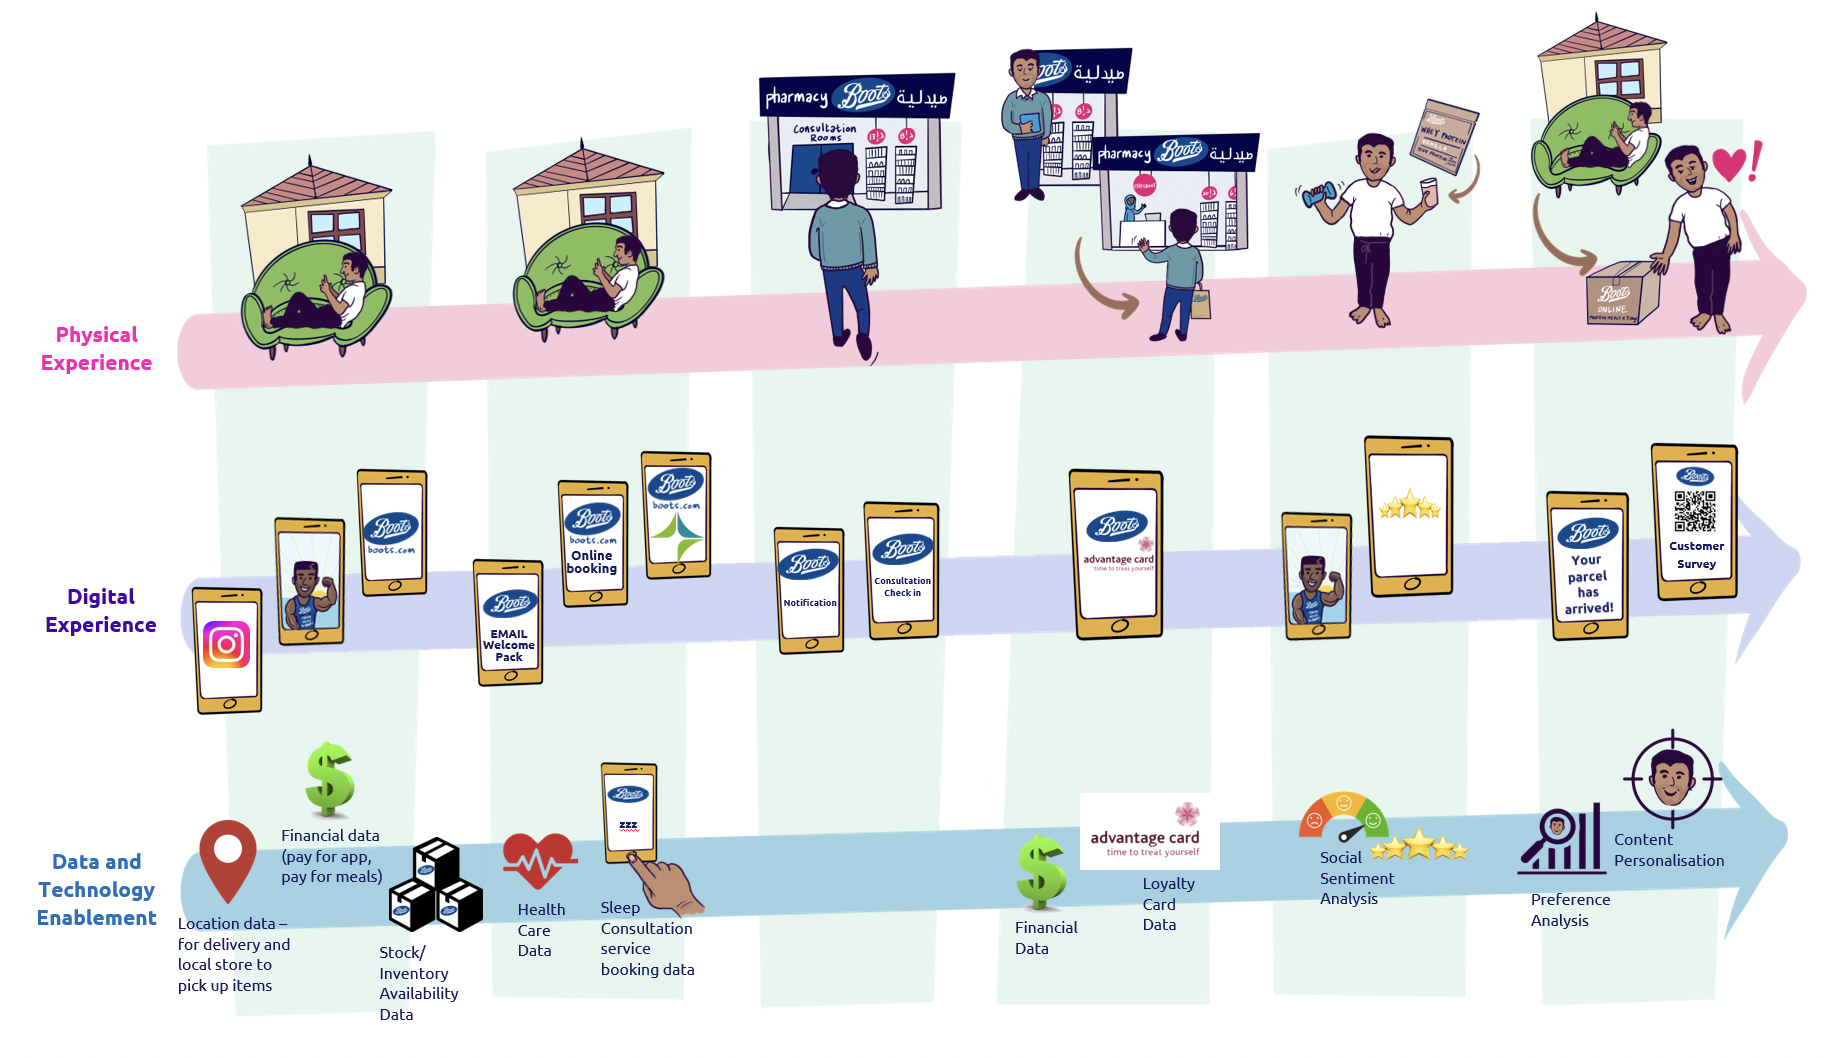
A flowchart illustrating the customer journey with Boots pharmacy, from physical experience through digital experience to data and technology enablement. It includes steps like visiting the pharmacy, entering consultation rooms, using mobile apps for booking, notifications, and reviews, and collecting loyalty and customer data, with icons representing health, sleep, stock, and financial data.
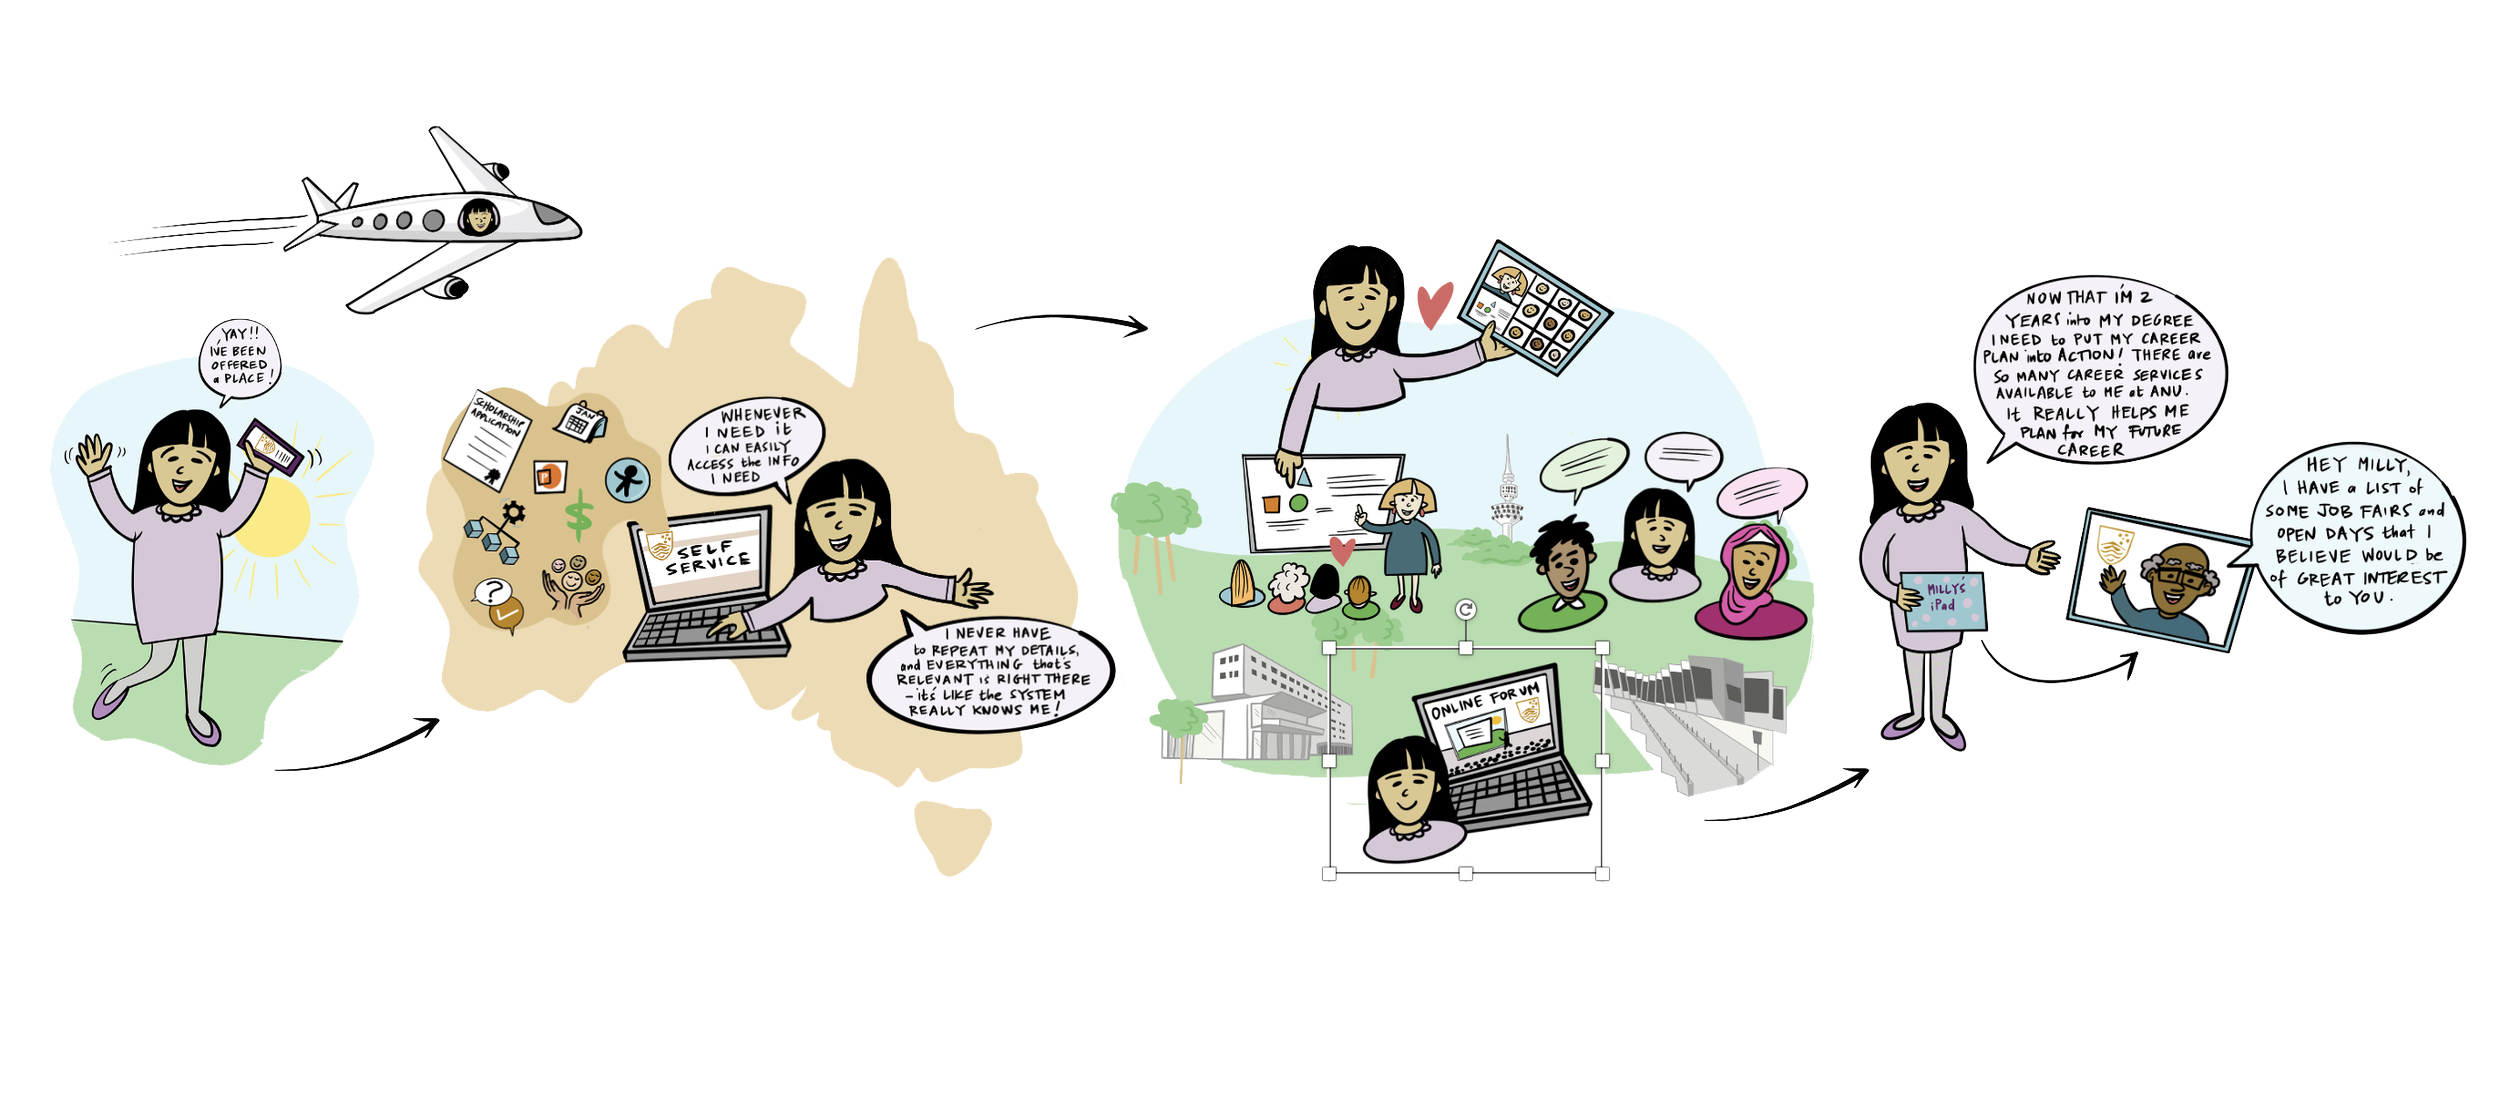
A colorful illustrated infographic about career planning, showing a woman celebrating a job offer, accessing career information online, talking to friends, and sharing resources for job interests and career development.
Illustration showing a frustrated man with surrounding images of a stopwatch, gears, communication, payments, and invoicing. Text discusses the need for understanding impacts on business processes and client communications, highlighting potential challenges. Stages include awareness of transition and checking information accuracy.

ILLUSTRATING your value proposition
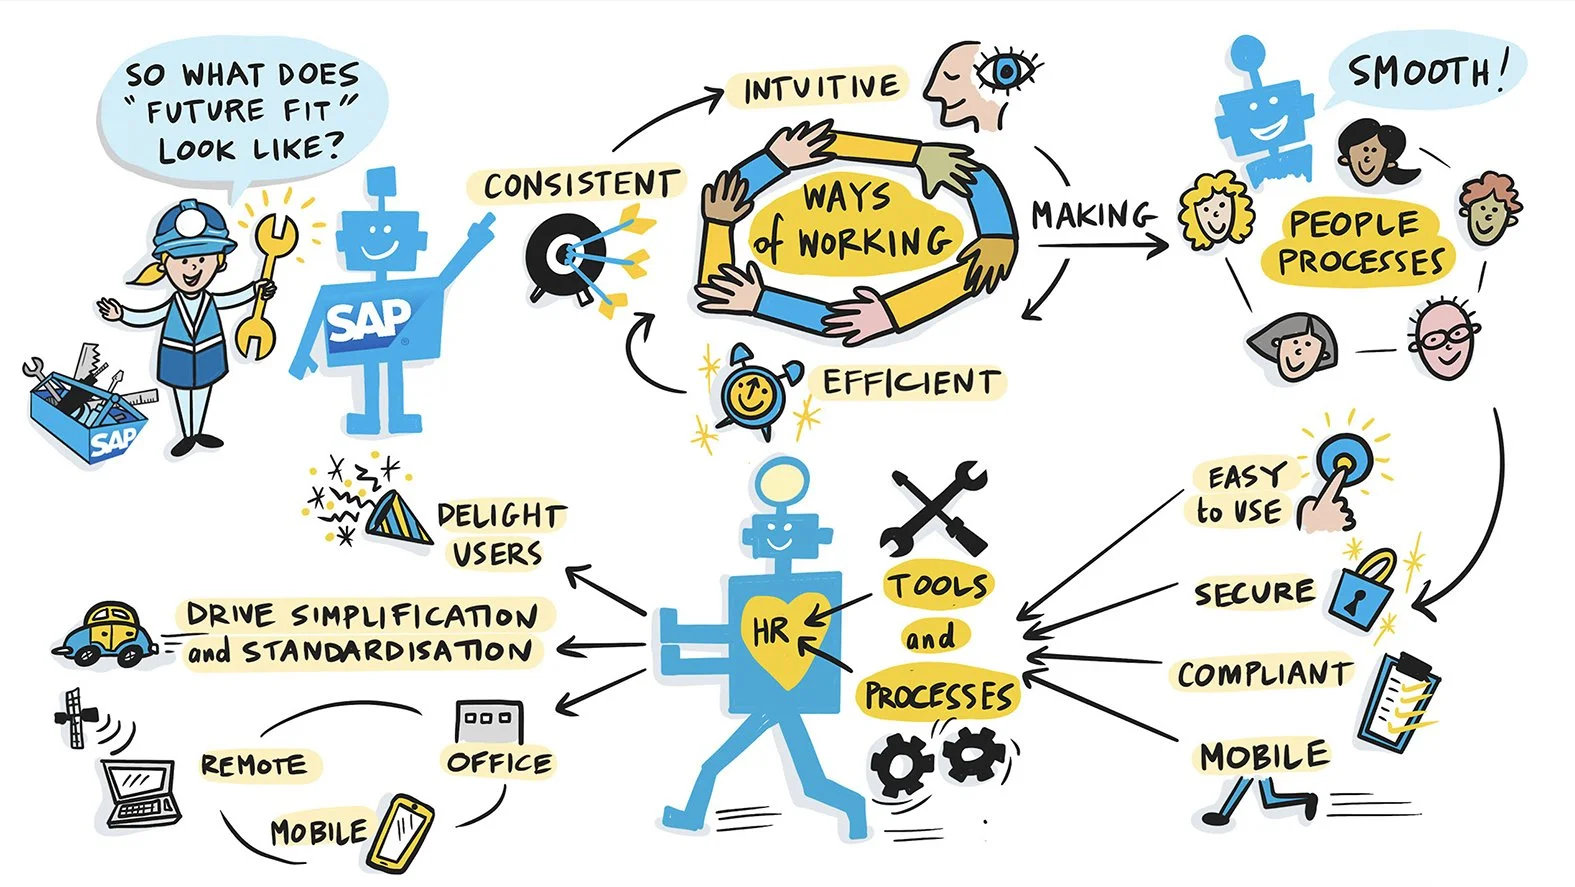
A colorful infographic illustrating ways of working, emphasizing consistency, intuitiveness, efficiency, and tools. It highlights human resources, user delight, process standardization, and mobility, along with benefits like security, compliance, and ease of use.
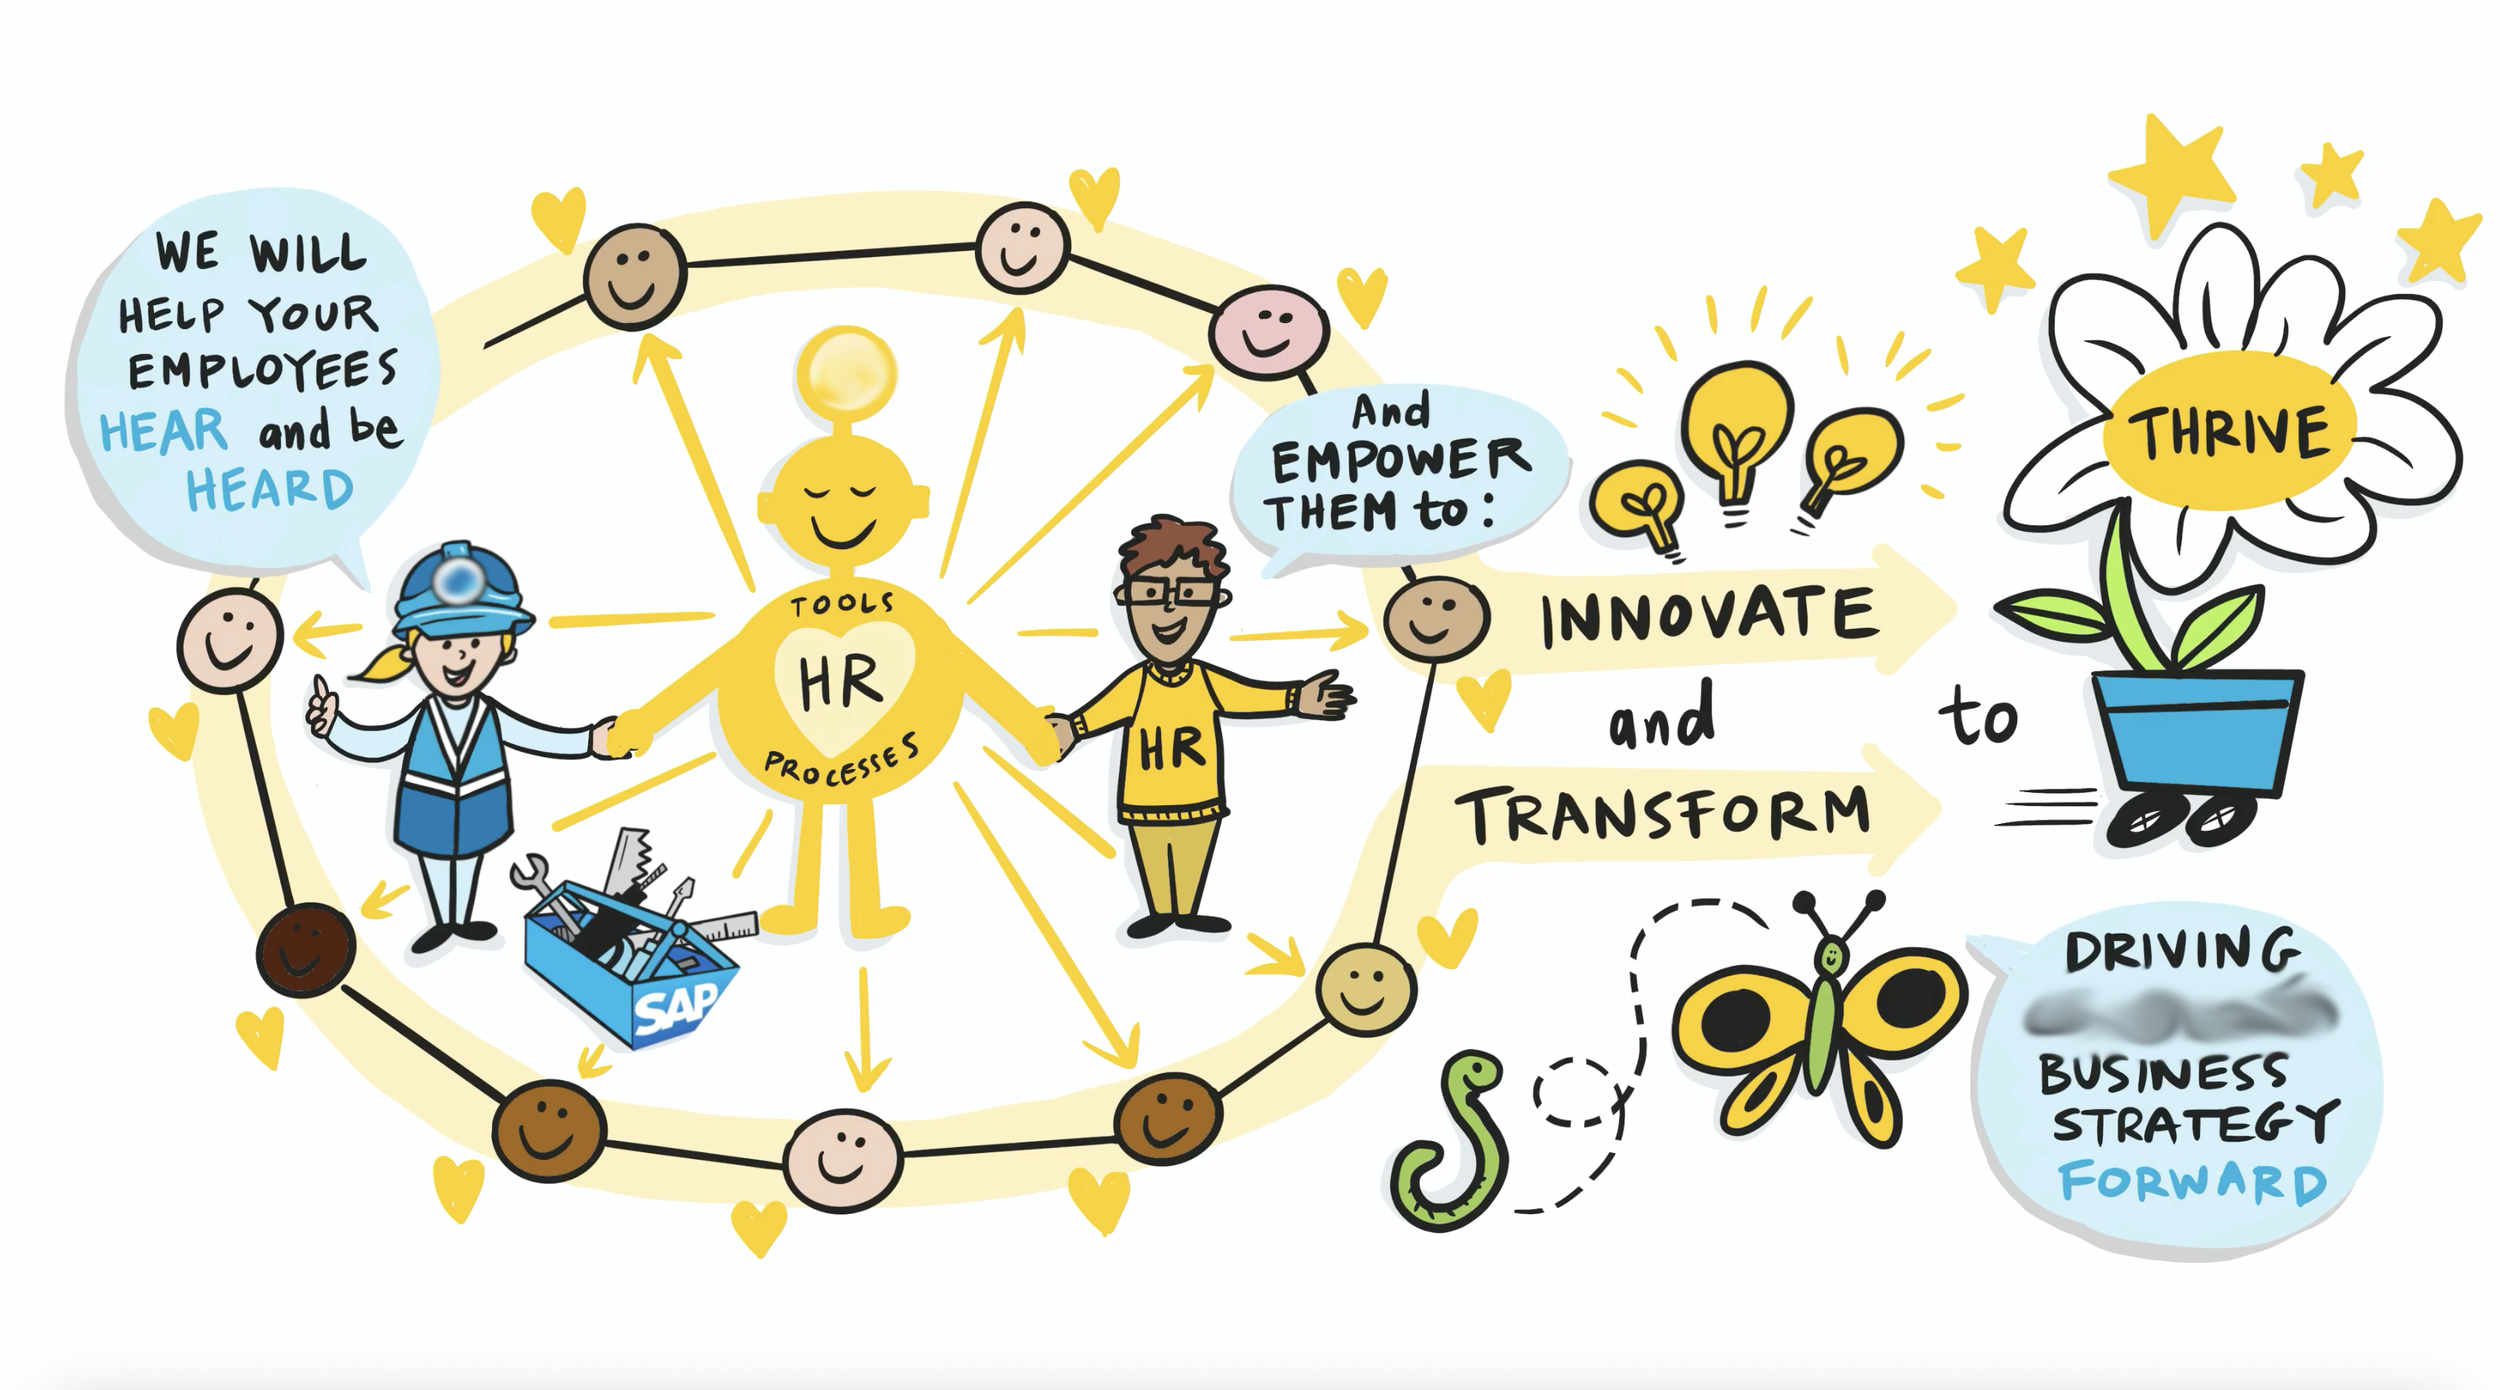
An illustrated infographic showing how HR helps employees to hear and be heard, empower them to innovate and transform, leading to thriving in business.

HIGHLIGHTINGchanges, principles & technological approaches
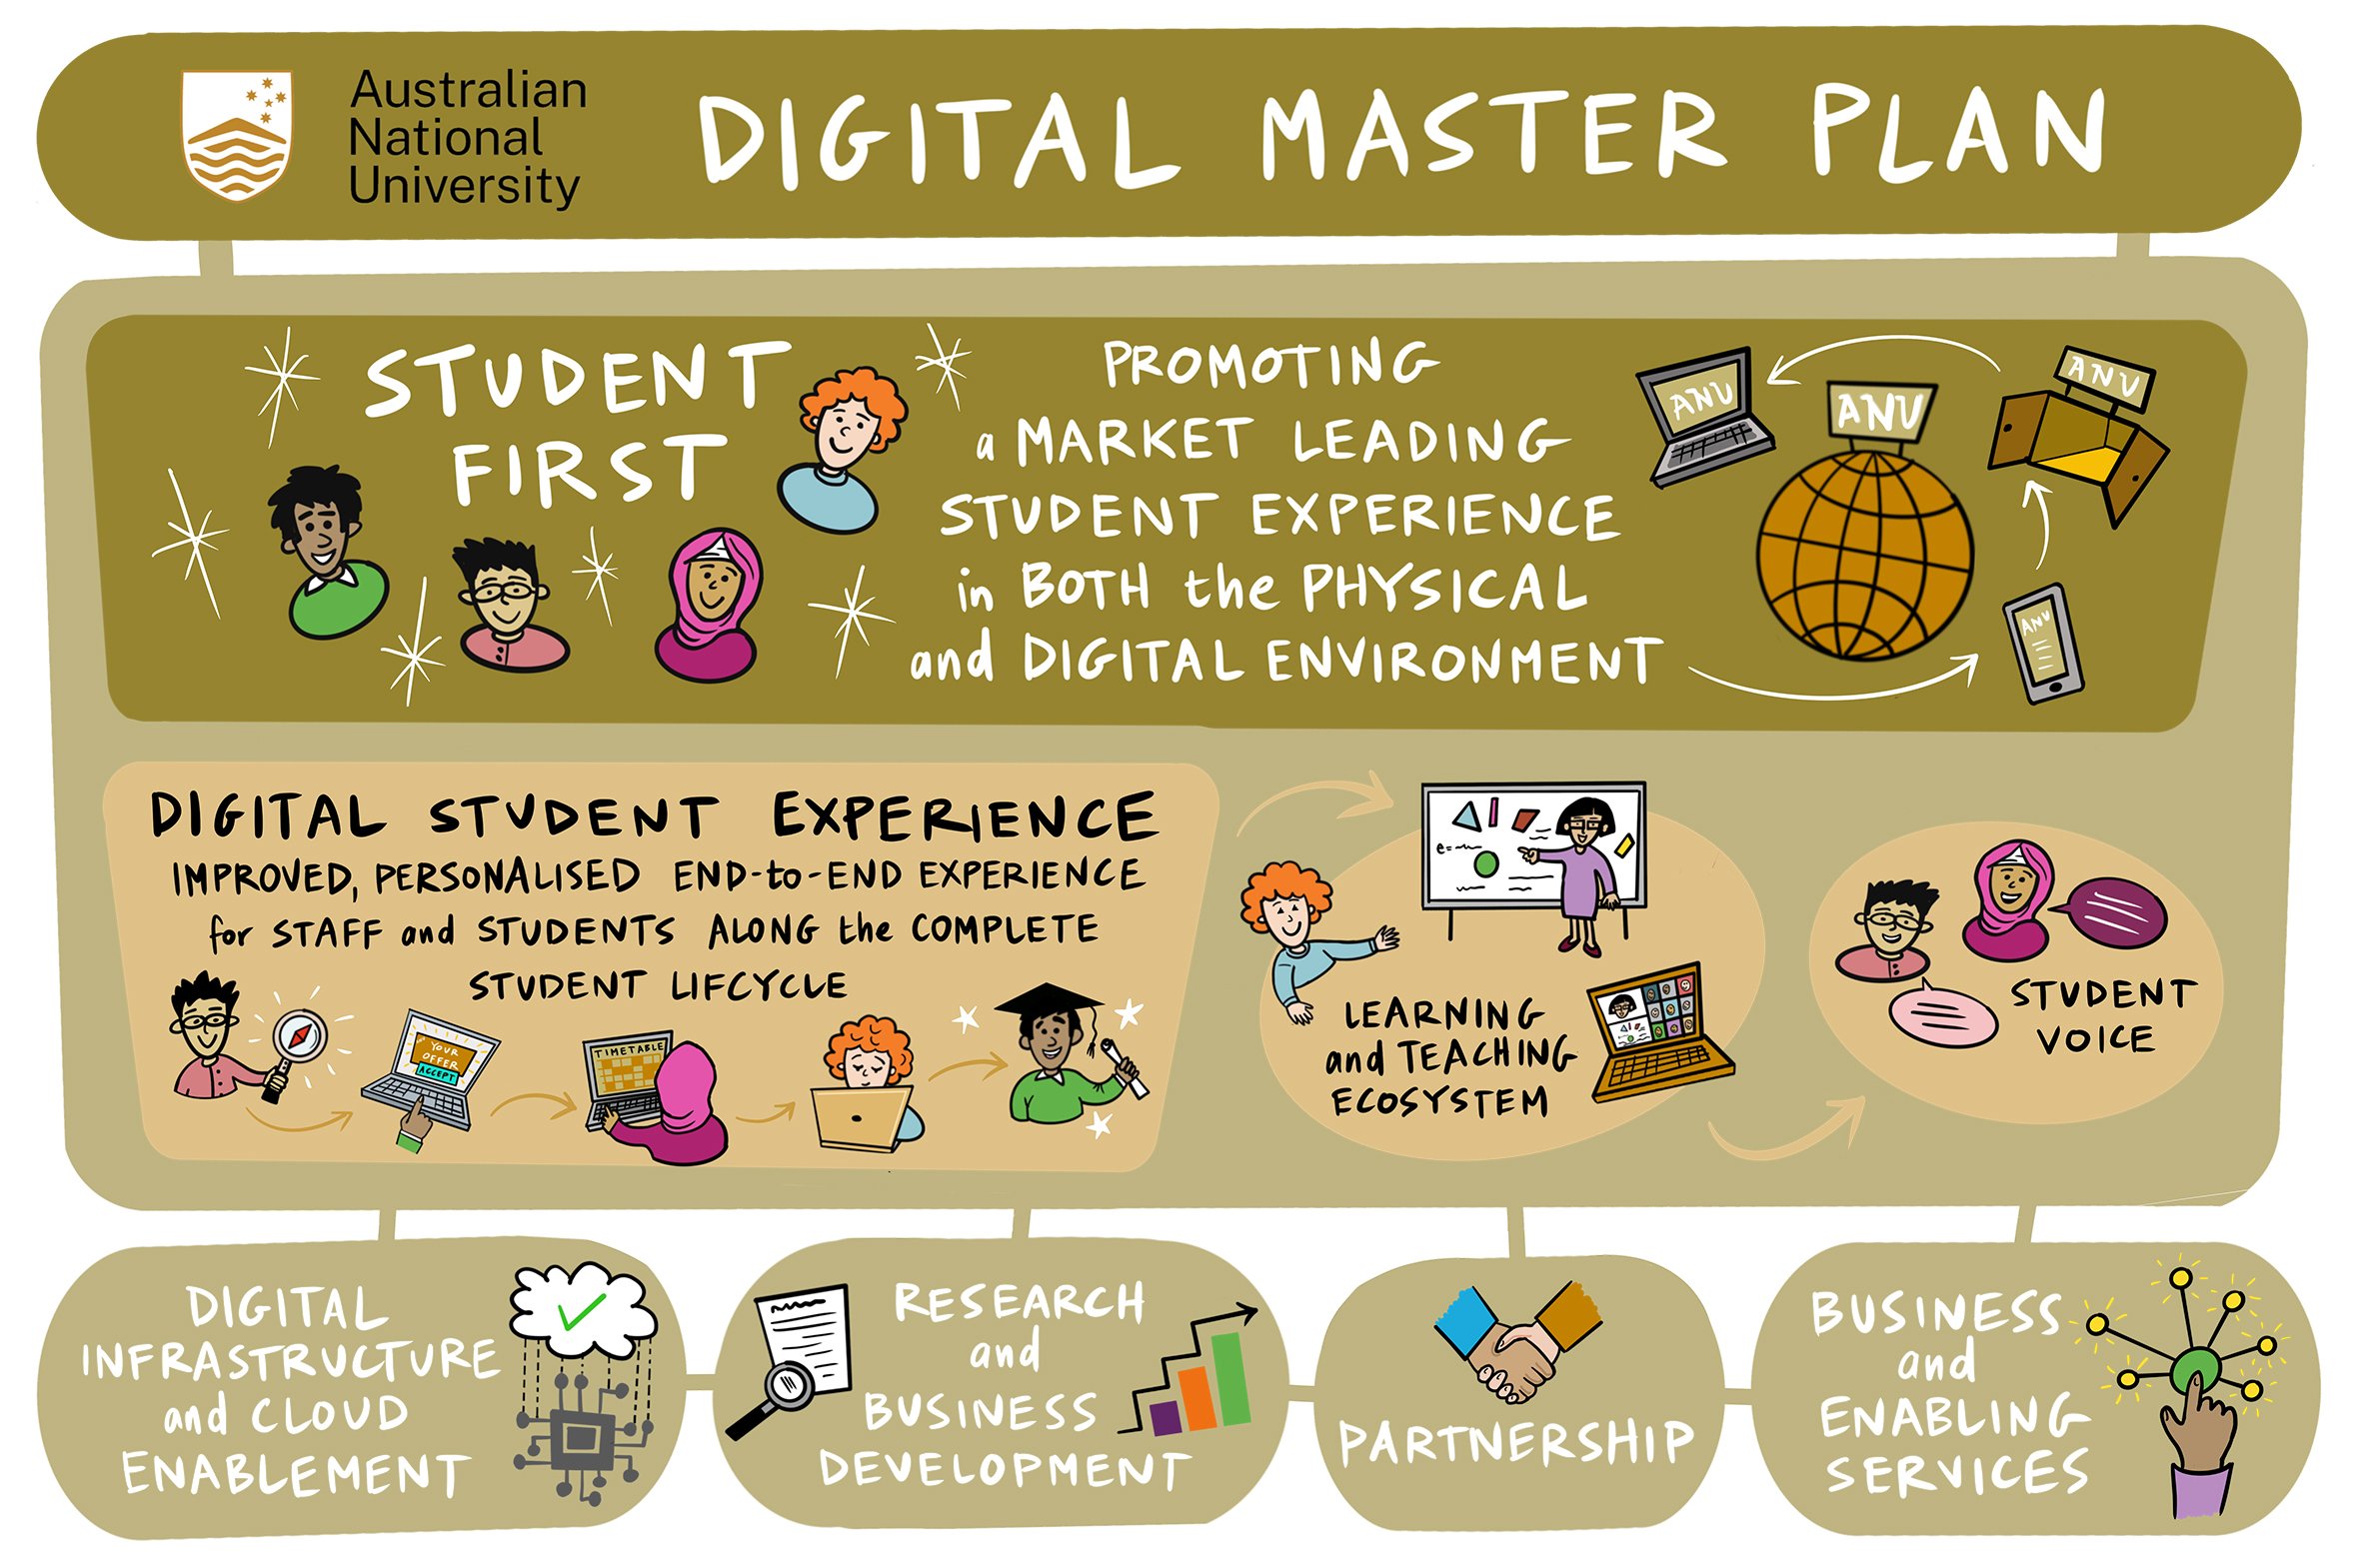
A colorful infographic titled 'Australian National University Digital Master Plan' emphasizes promoting a market leading student experience, highlighting the importance of digital infrastructure, learning, teaching, research, business development, and services, with illustrations of students, laptops, globe, and digital devices.
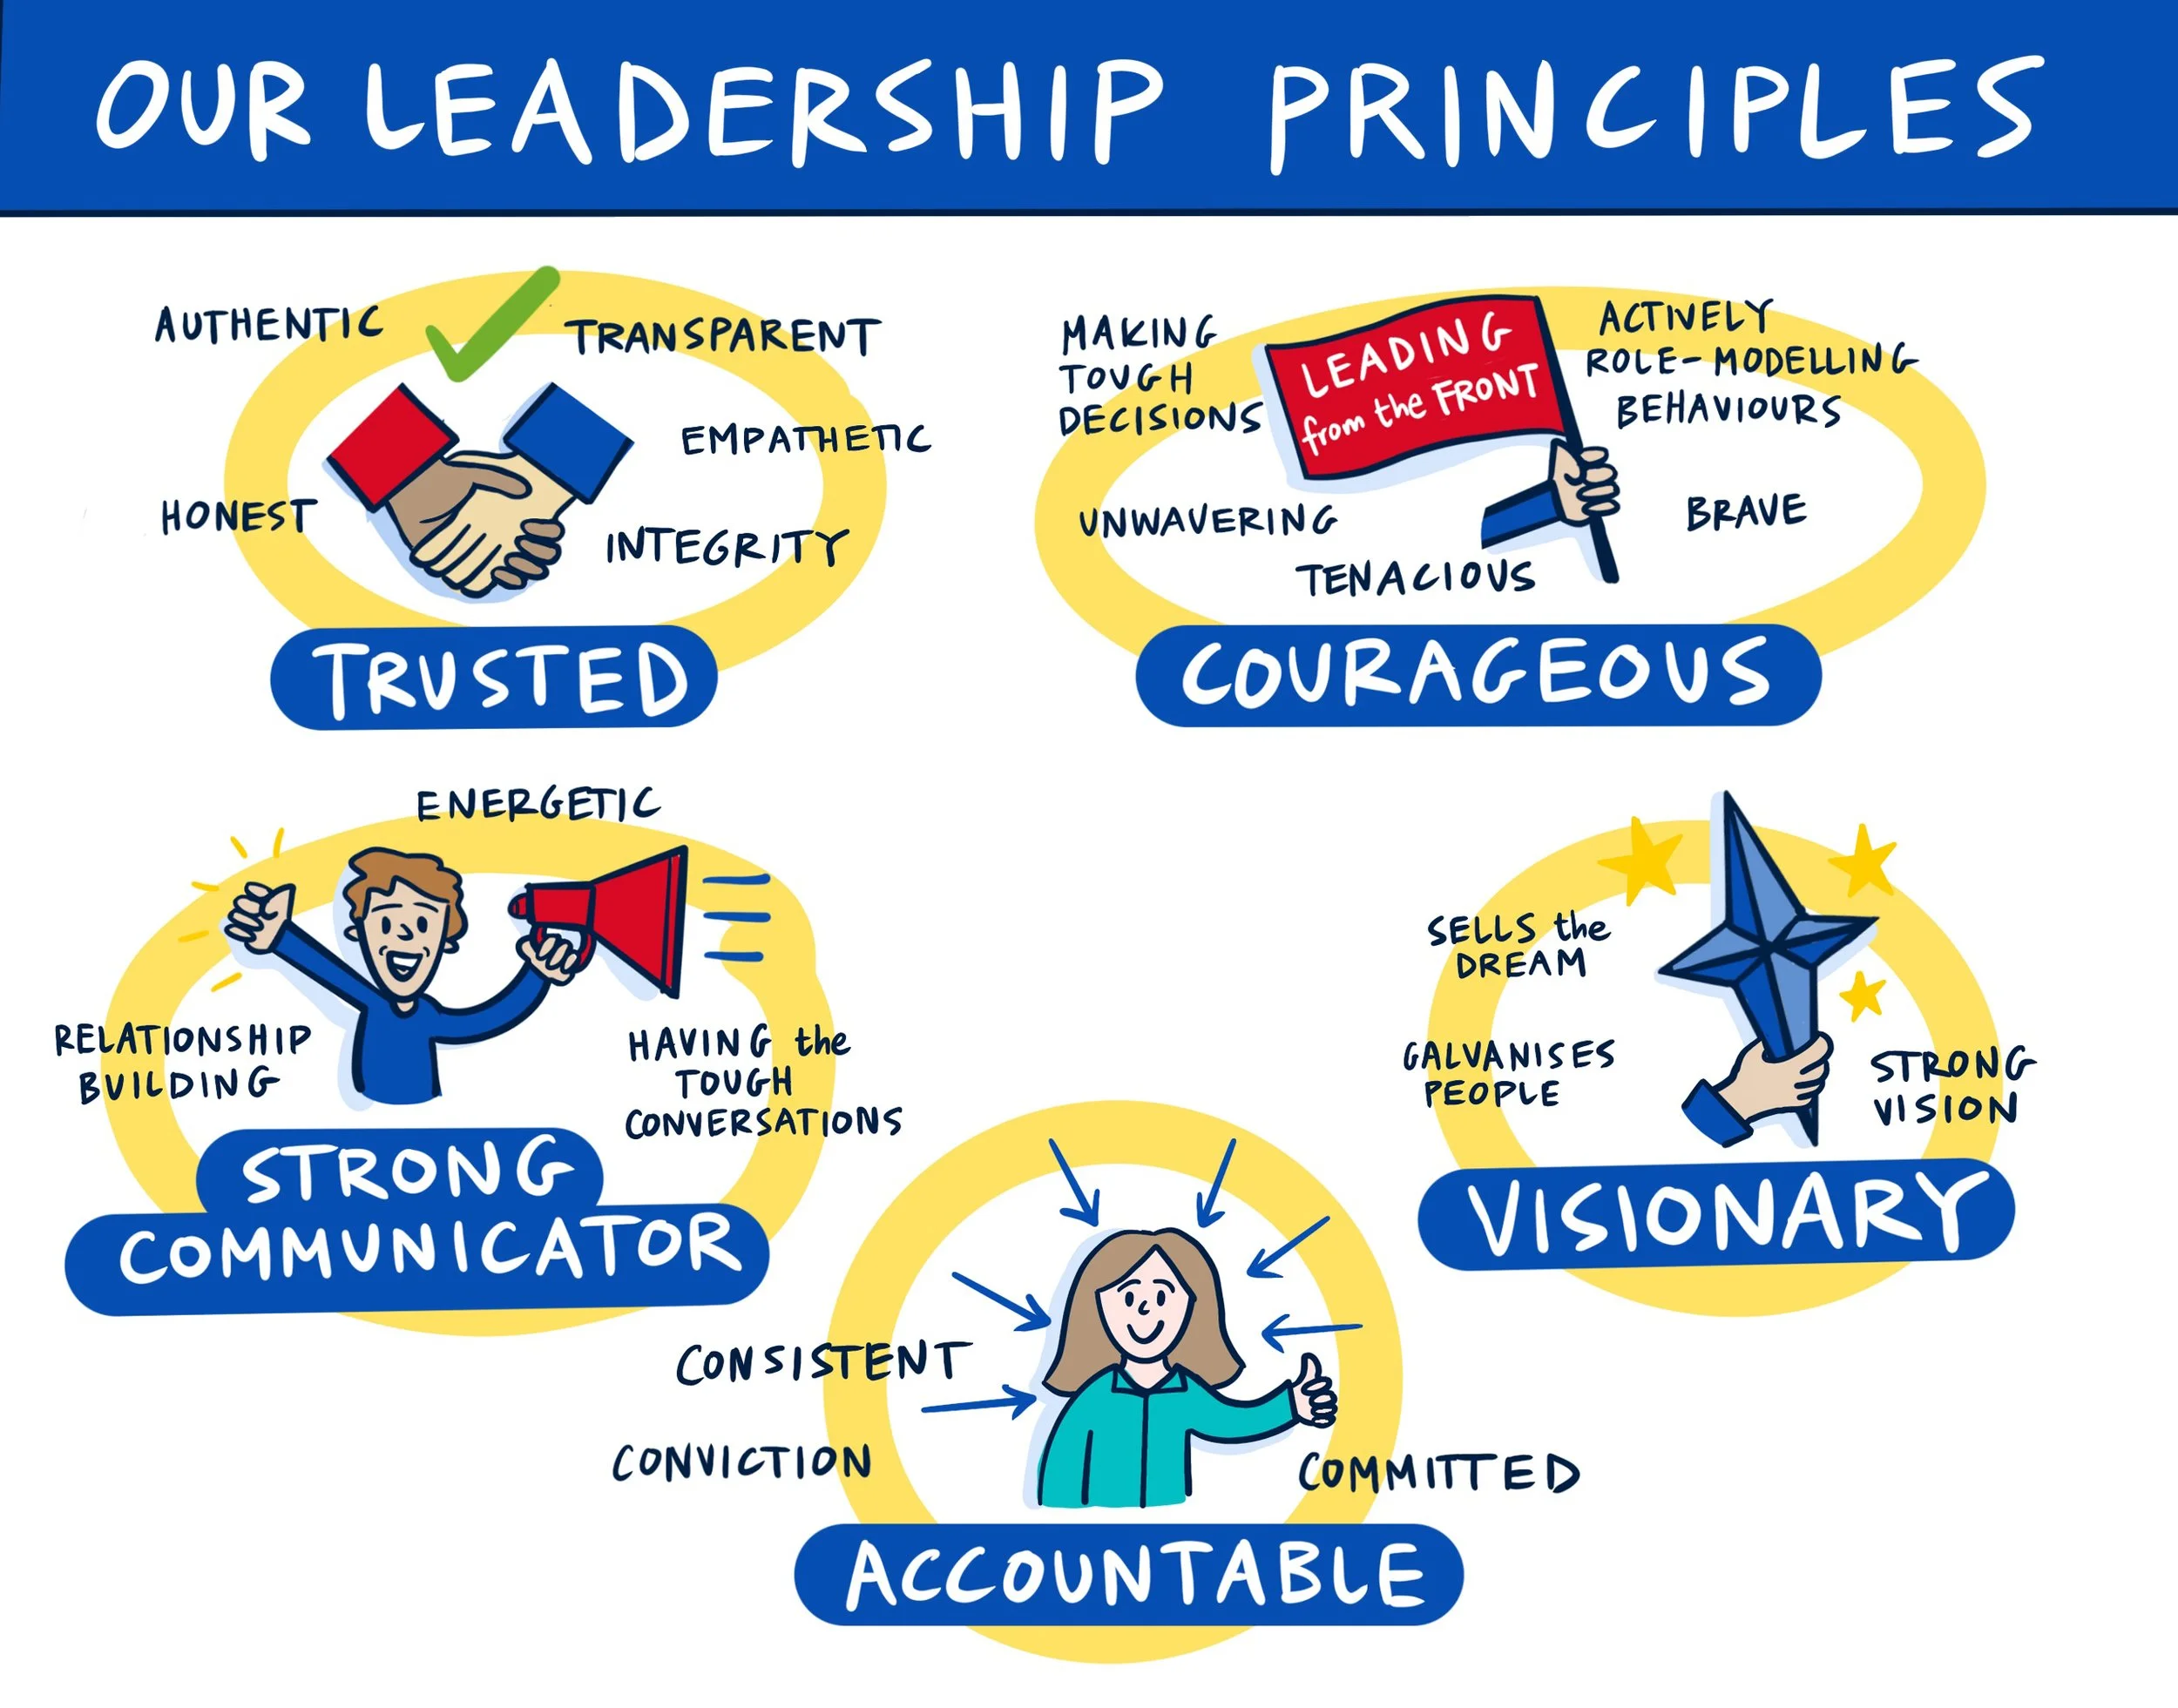
Illustrated infographic displaying leadership principles: trusted, courageous, strong communicator, visionary, accountable, and other qualities with corresponding icons and keywords such as honesty, integrity, empathy, tough decisions, brave, commitment, and confidence.
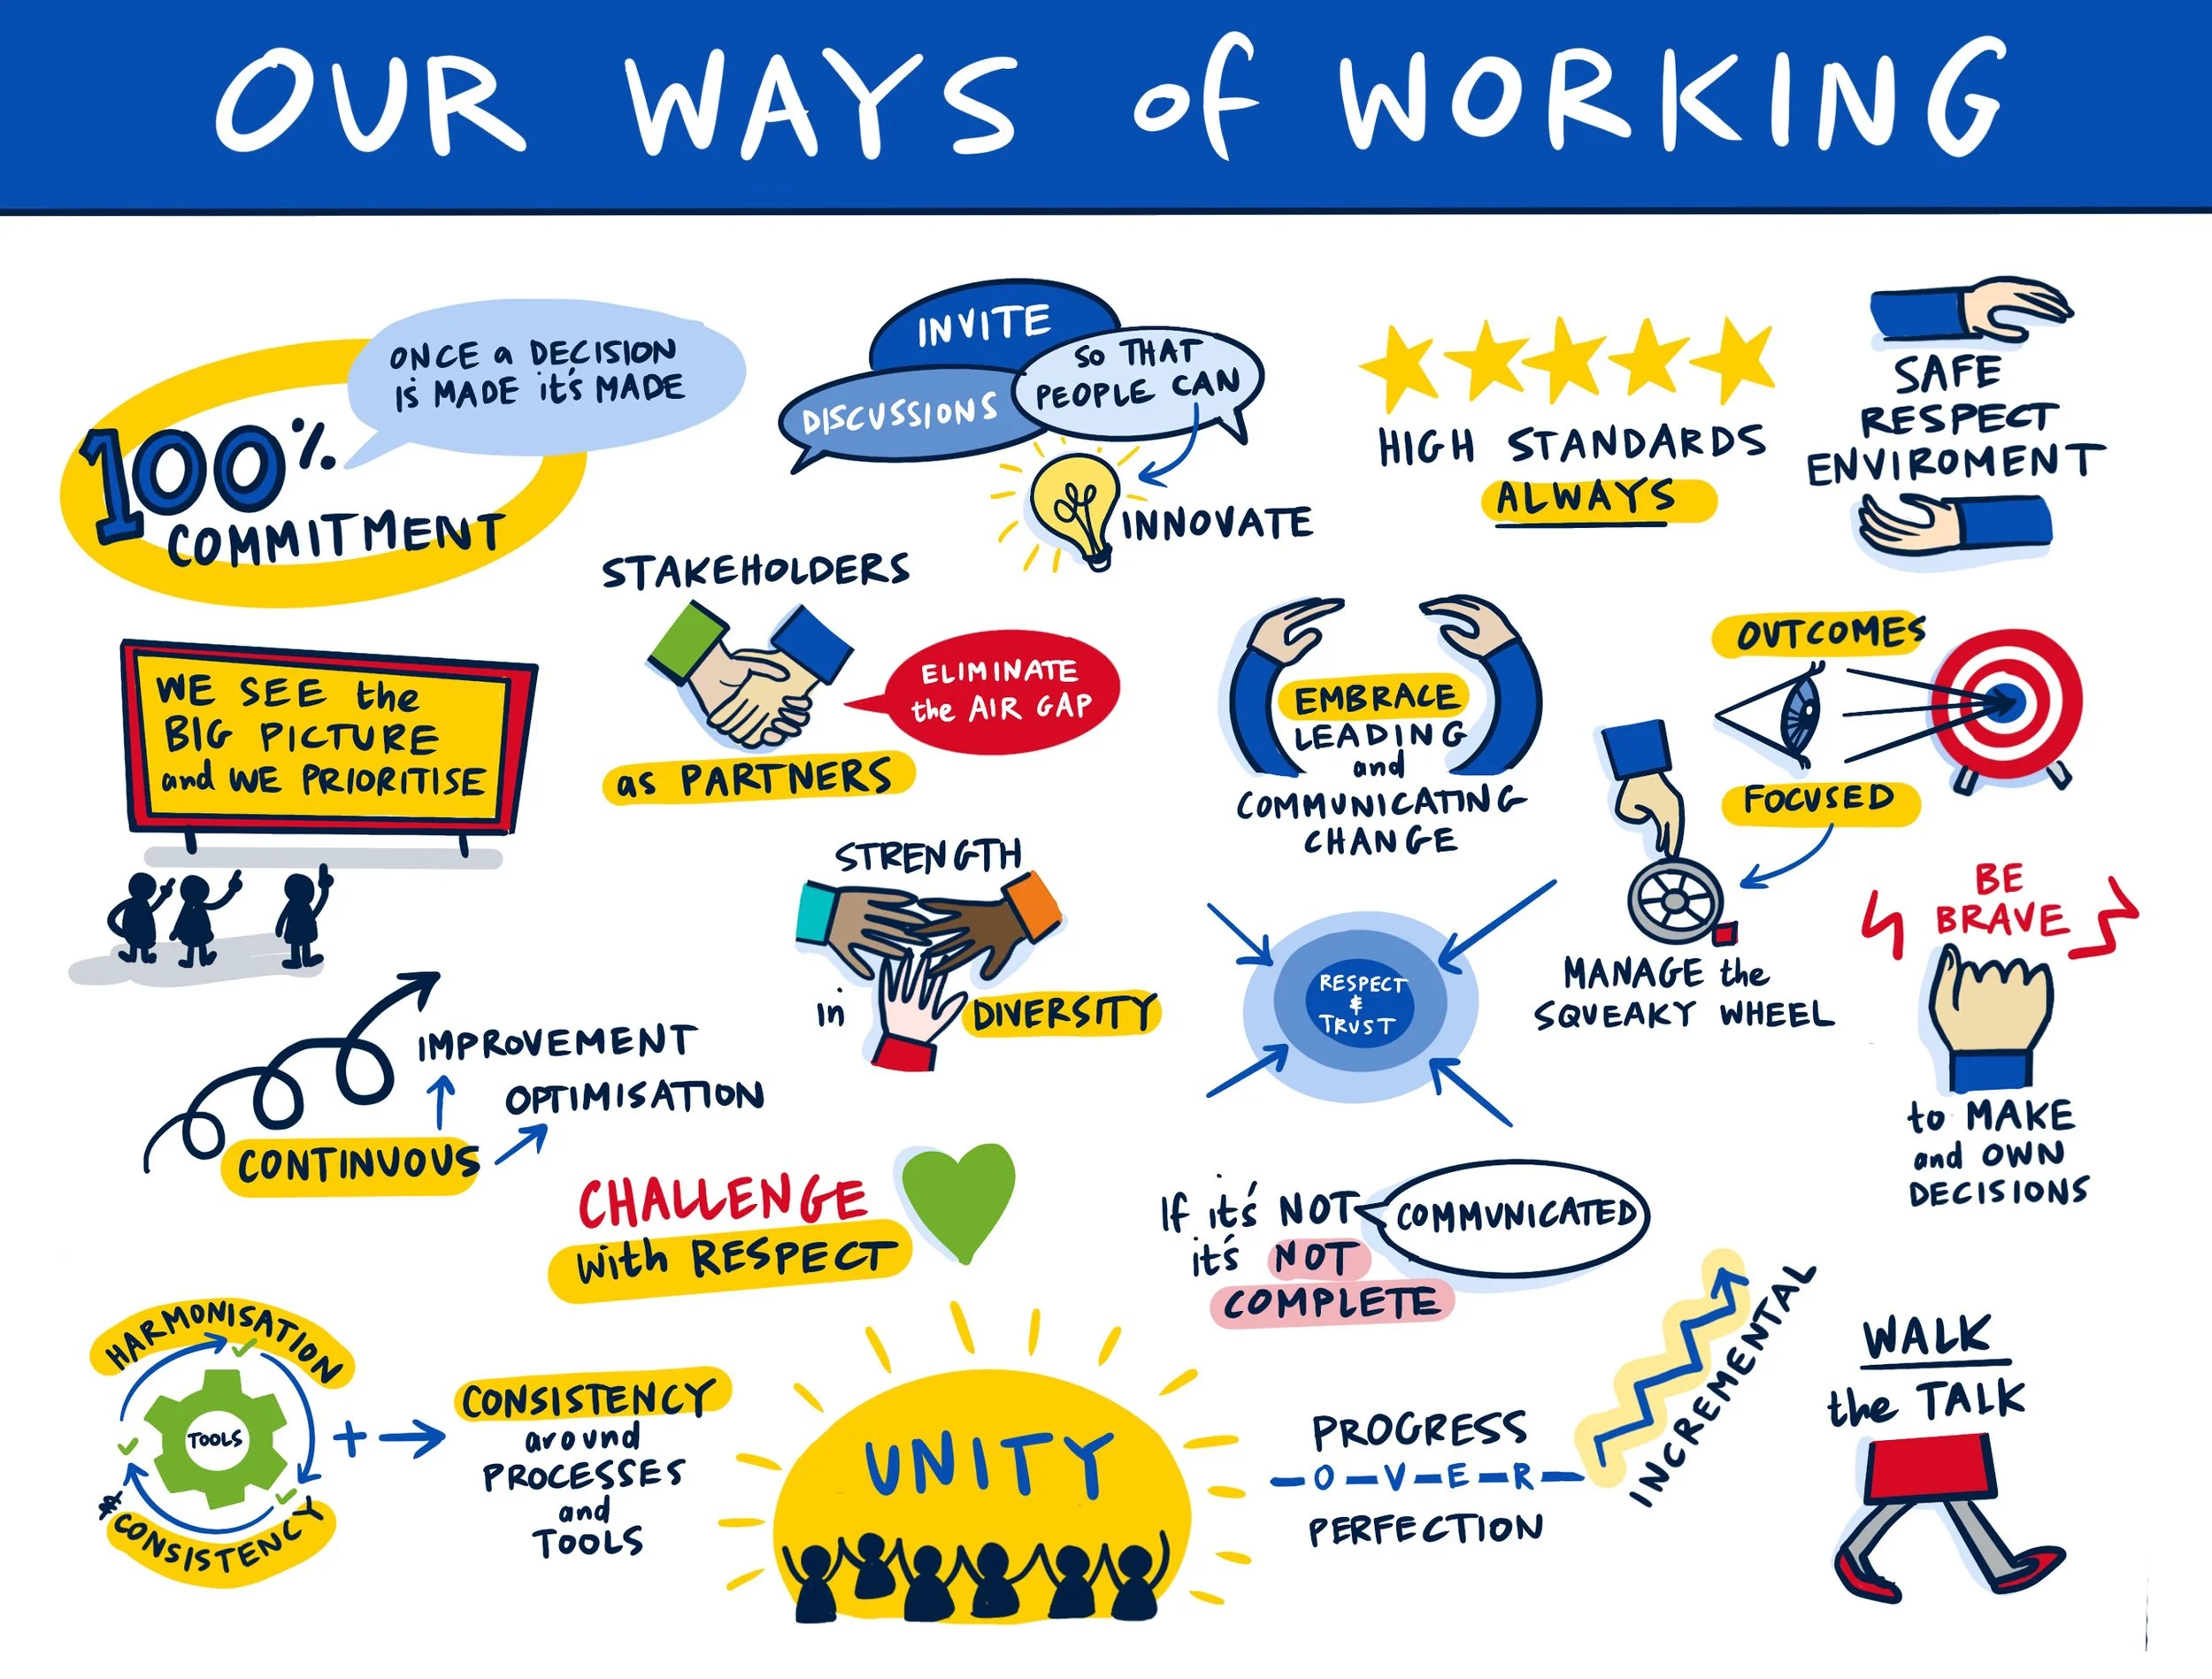
An illustrated infographic titled 'Our Ways of Working' that outlines principles like commitment, diversity, unity, respect, communication, continuous improvement, focus, and harmony, with icons and handwritten notes emphasizing collaboration, high standards, respectful environment, focused goal setting, and ongoing progress.
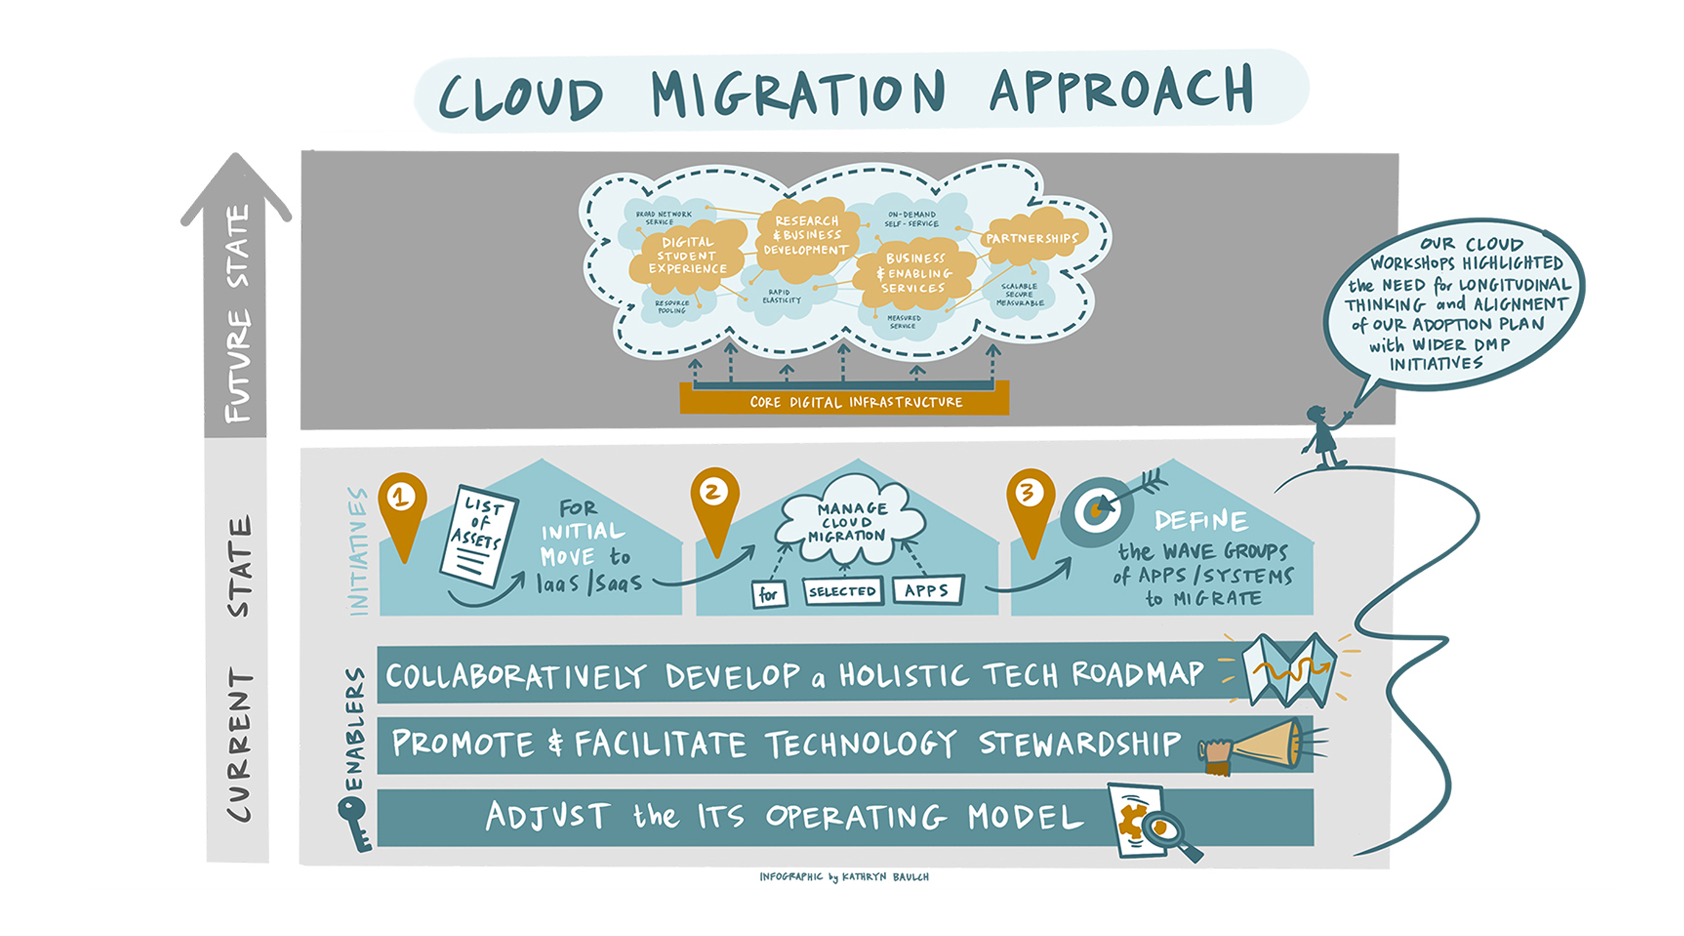
Diagram illustrating the cloud migration approach with three stages: initial move, manage cloud migration, and define wave groups of apps/systems to migrate, supported by efforts to develop a holistic tech roadmap, promote technology stewardship, and adjust operating models.

BOOK illustrations

Illustration titled 'The Vital Signs of Organisational Change-Fitness' depicting factors for organizational change including culture, strategy, leadership, team, and execution. It features diagrams, flowcharts, and icons representing concepts such as stakeholder trust, resilience, inner leadership development, team dynamics, and effectiveness.

“Kathryn collaborated with me to bring the illustrations for my leadership and innovation book Traction: the 4 practices of change-fit leadership teams to life. I really appreciated her collegiate style to meet our timelines and the quality of her work.”

Bernie Kelly
The Fit FOR PURPOSE Leaders & Organisations Transformation Platform.

Cover of the book 'Traction: The 4 Practices of Change-Fit Leadership Teams' by Bernie Kelly, featuring illustrations of leadership concepts such as self-accountability, self-awareness, perspectives, and curiosity.